Engine Development Division
Power System Operations Business
YANMAR Technical Review
Vibration Transfer Path Analysis for Combine Harvester Using Multibody Dynamics for EngineHybrid Method Combining CAE and Experiment
1. INTRODUCTION
Diesel engines are the main power source used in agricultural and construction machinery and also a source of vibration. Engine vibration resulting from combustion pressures in the cylinder, the motion of the crankshaft system, and other sources transfers via the engine mounts to the machine, influencing the vibration of the entire vehicle. To reduce the vibration at evaluation points represented by the operator position, it is important to take any measures to the most contributory vibration transfer path among the vibration transfer paths from the source to the evaluation points. The transfer path analysis is used as a method to analyze the contribution of vibration transfer paths.
In the transfer path analysis, the vibration system is divided into two parts, and the part of the vibration source such as the engine and other is treated as the active part and the transfer path including evaluation points such as the operator position is treated as the passive part. To perform the transfer path analysis, inputs from the active part to the passive part and Frequency Response Functions (hereafter FRF) from the input points to the evaluation points are required. The FRFs can be measured by excitation tests using an impact hammer or a vibration exciter. In contrast, it is often difficult to directly measure the input to the passive part. This is because force sensors are required to be fitted at the input points but there is special constraints during the experiments. Instead, the mount stiffness method or the inverse matrix method are widely used for indirect input identification(1). However as these input identification methods are experimental methods, the input parameter study of vibration at the evaluation points cannot be performed.
Progress in CAE in recent years has made it possible to analyze engine dynamic behavior using multibody dynamics(2) (3). This makes it possible to obtain the transmitted vibration force from the engine to the machine with good accuracy(4) (5).
This paper describes a hybrid transfer path analysis method using the transmitted vibration force obtained by engine multibody dynamics and the FRF obtained experimentally. The advantage of the proposed hybrid method is shown by applying it and the current mount stiffness method to the vibration at the operator position of a conventional combine harvester.
2. Method
2.1. Theory of Transfer Path Analysis
The transfer path analysis is a method to identify contributory paths for the response at the evaluation points(1). The response vibration at the evaluation point
 is expressed by the following equation using the input
 to the path

Here, is the angular velocity,
 is the FRF for the path
 from the input point to the evaluation point
 , and
, and is the contribution vibration by the path
 .
.
The contribution of each transfer path to the evaluation point can be defined as the projection of contribution vibration on the response vibration
 , which can be expressed as follows.

Here, is the contribution of the path
 to the vibration at the evaluation point, and
 is the conjugate complex of
The mount stiffness method is used to compare with the proposed method as an input identification method. This method performs input identification by using the displacement difference between the active and passive parts at the input point and the complex dynamic stiffness at the input point. The input of the mount stiffness method can be expressed as follows.

Here, is the complex dynamic stiffness at the input point,
 is the active part displacement at the input point for the path
 , and
, and is the passive part displacement at the input point for the path
 ,
, is the active part acceleration at the input point for the path
 , and
, and is the passive part acceleration at the input point for the path
 .
.
2.2. Combine Harvester Used in Experiment and Vibration Transfer Path
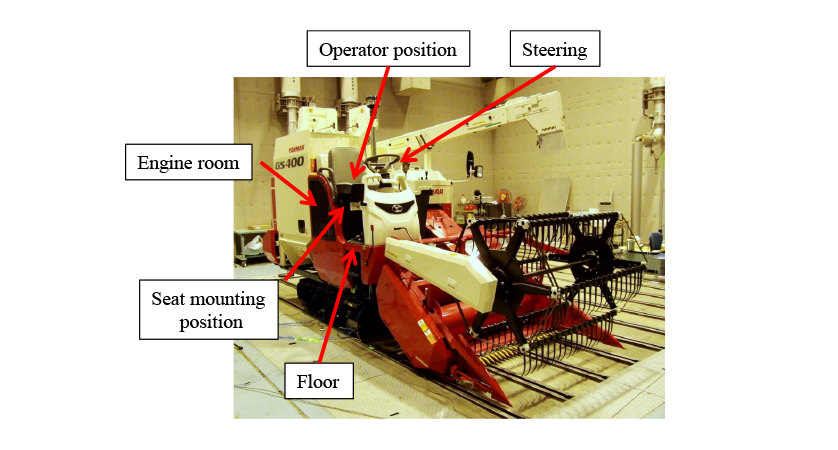
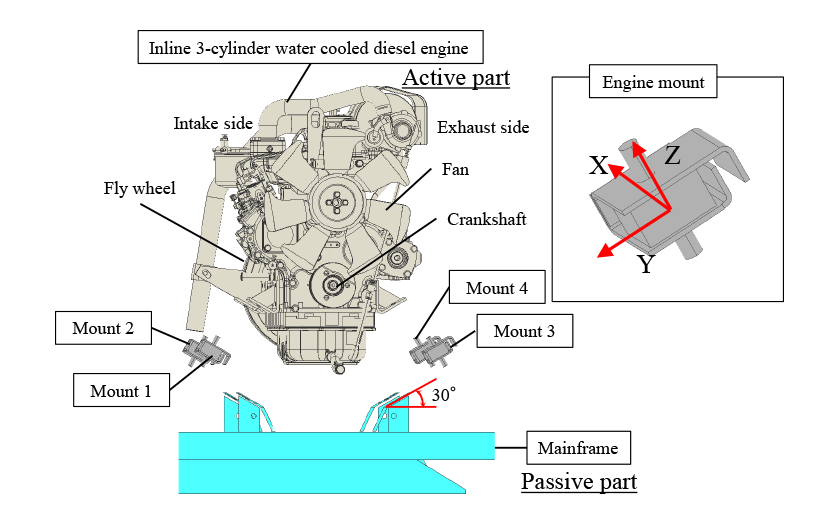
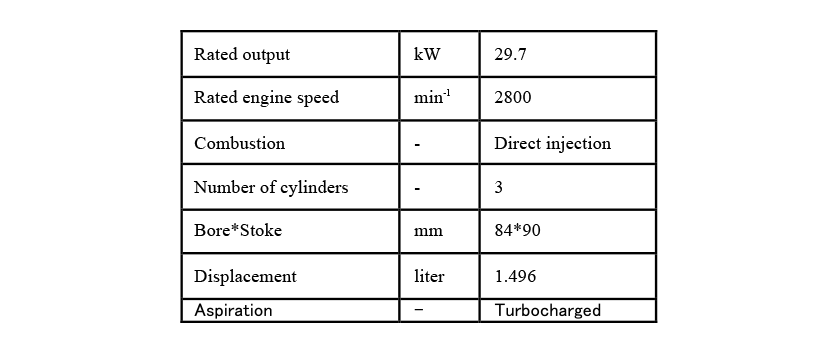
Fig. 1 shows the conventional combine harvester used in the experiment. The evaluation points are the seat mounting position, floor, and steering. The evaluation condition is the vibration at the engine idling while the thresher and reaper are not operating. Fig. 2 shows the engine mounting layout. The engine room is located below the operator’s seat and an inline 3-cylinder vertical water-cooled diesel engine (see Table 1) is installed. The engine is mounted to the mainframe by vibration isolating rubbers (hereafter engine mount) at four points. These engine mounts are mounted at an angle of 30° to the horizontal plane. The designations of engine mounts are shown in Fig. 2. Totally 12 paths which are three-axis directions (X, Y and Z direction) for four engine mounts are considered as the vibration transfer paths. X direction is the axial direction of the crank shaft, Z direction is the compression direction of the engine mount and Y direction is the direction of perpendicular to X and Z.
2.3. Analytical Model of Transmitted Vibration Force
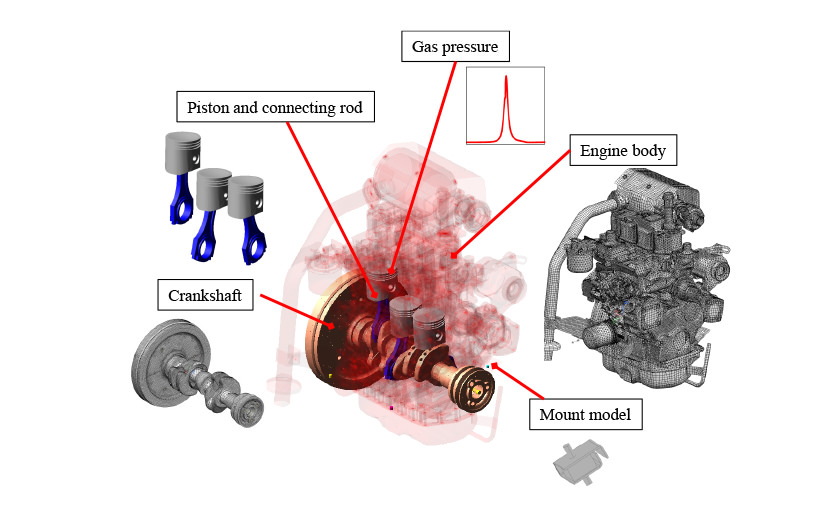
This section describes a multibody dynamics model that calculates the transmitted vibration force from the engine to the main frame of the combine harvester. Fig. 3 shows an overview of the multibody dynamics model. The definition of engine components and joints connecting them are as follows.
- Crankshaft, engine body: Flexible body model with reduced degrees of freedom using the Craig-Bampton method
- Piston and connecting rod: Mass properties and center of gravity obtained by a 3D model
- Cylinder pressure: Experimental data
- Main bearing and crank pin bearing: Rotating joint
- Thrust bearing: Constrained in the crank shaft axial direction only
- Piston-cylinder block: Translational joint
- Engine mount: Considers characteristics of frequency dependence and amplitude dependence
- Mainframe: None (ground part)
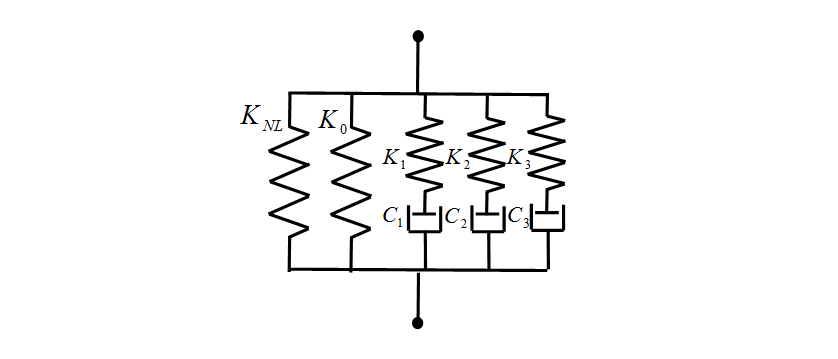
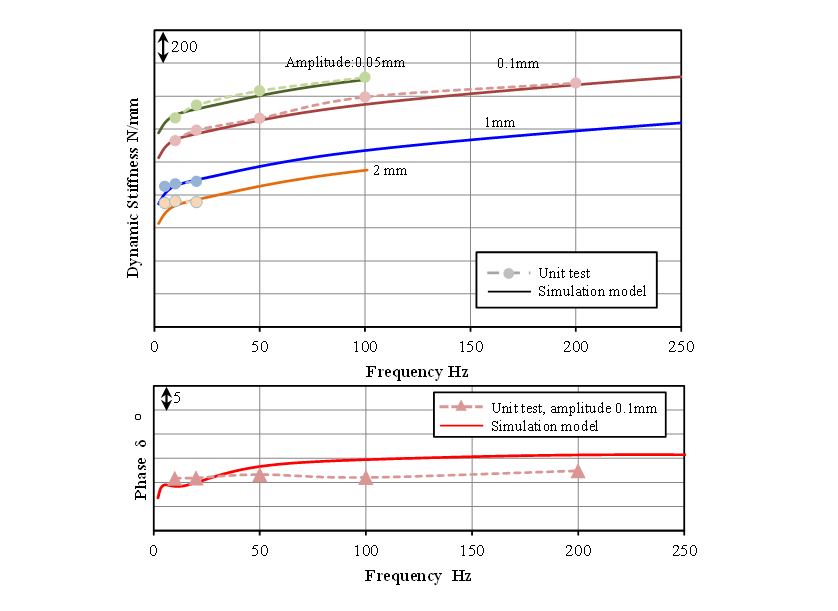
The components are located in 3D space and connected by joints. Fig. 4 shows the engine mount model used in multibody dynamics. A generalized Maxwell model is used to express the frequency dependent characteristic of the engine mount (6). To represent the amplitude dependent characteristic of the engine mount, a non-linear spring which load varies with displacement is added to the generalized Maxwell model. Fig. 5 shows the complex dynamic stiffness of the engine mounts measured in unit test(7) and the complex dynamic stiffness used in the analytical model. The number of Maxwell models is defined as three, with the spring and dashpot values identified from the results of the unit test of engine mounts.
2.4. Identification of Transmitted Vibration Force and Measurement of Frequency Response Function
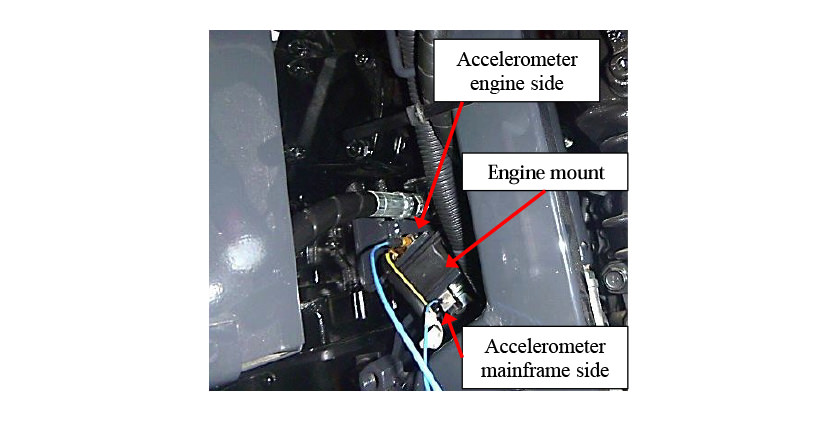
To compare with the transmitted vibration force obtained by multibody dynamics, the transmitted vibration force while the engine is operating is identified using the mount stiffness method. As shown in Fig. 6, the acceleration of the engine mounts is measured on both the engine side and mainframe side. The measured acceleration signals are then converted from the time to the frequency domain using a Fast Fourier Transform (FFT). The frequency analysis resolution is 1 Hz and number of averaging is 30 times. The phase reference for each signal during averaging is the phase of the up and down direction of mount 1. As indicated by equation (3), the transmitted vibration force is obtained by twice integrating the measured accelerations in the frequency domain and multiplying by the complex dynamic stiffness.
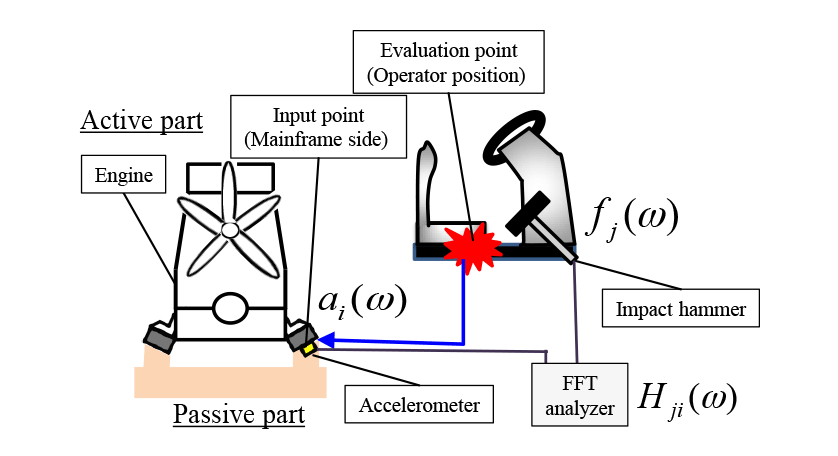
An impact hammer and accelerometer are used for the measurement of the FRF as shown in fig. 7. Because it is not possible to excite directly to the engine mount positions, the FRFs are measured using the reciprocity principle. Using the reciprocity principle, the FRF from the input point to the evaluation point is expressed by the following equation.

Here, is the response acceleration at point
 when the point
 is excited by the force
 and
and is the response acceleration at point
 when the point
 is excited by the force
 .
.
3. Results and Discussion
3.1. Transmitted Vibration Force
This section describes the accuracy of the transmitted vibration force obtained by the multibody dynamics model. Fig. 8 compares the transmitted vibration forces obtained from the multibody dynamics and from experiment. As the results obtained by multibody dynamics are in the time domain, they are converted to the frequency domain by FFT to compare. The engine speed is 1500 min-1 at idling. The results show that the peak transmitted vibration forces occur at half-order harmonics of the engine speed. In particular, the peaks are large at the first order (25 Hz) and the 1.5th harmonic (37 Hz). These are the same to both the analytical and experimental results. A comparison of peaks shows a good agreement between analytical and experimental results.
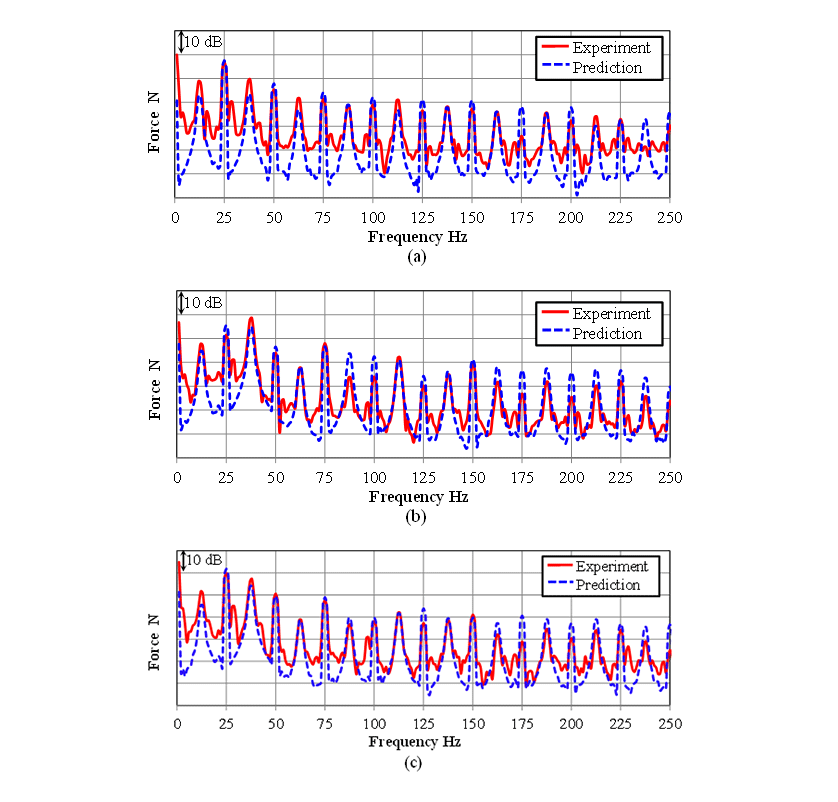
(a) X direction, (b) Y direction, (c) Z direction.
3.2. Transfer Response Function Measurement Results
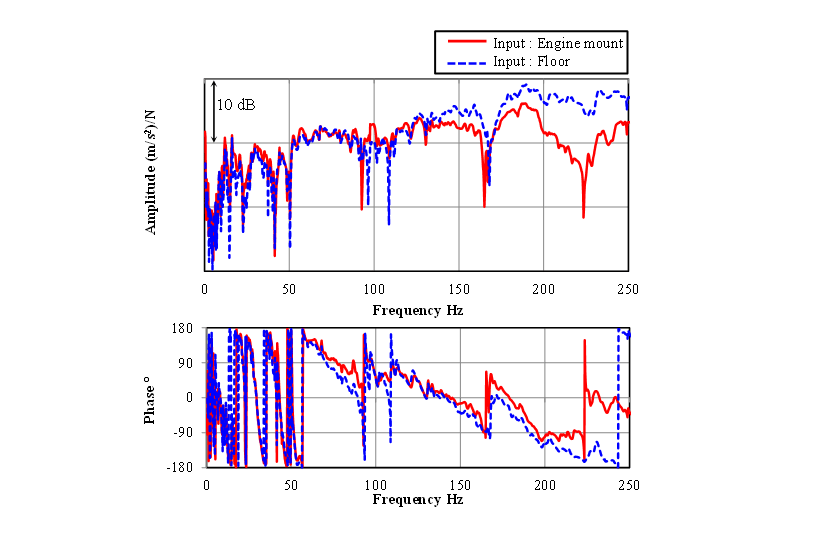
The reciprocity principle is used for the FRF measurement. At the beginning of the test, it is confirmed that the reciprocity principle can apply. Because it is not possible to excite at the engine mount positions, the applicability of the reciprocity principle was confirmed by exciting to the frame near the engine mounts. Fig. 9 shows the results of confirming reciprocity principle for the FRF from the vicinity of the engine mounts to the floor. The solid lines in the figures indicate the FRF when the input point is near the engine mount and the response point is the floor. The dashed lines indicate the FRF when the input point is the floor and the response point is near the engine mounts. A comparison of the FRFs show good agreement below 150 Hz for both amplitude and phase, and approves the reciprocity principle.
Fig. 10 shows the measured FRFs. Figs. 10a and 10b show the amplitude and the phase respectively and Fig. 10c shows the coherence. The coherence value is close to 1.0, except below 10Hz and at anti-resonance points, indicating a good correlation between input and output. Reasons for poor coherence are considered to be the low level of the response signal at anti-resonance points, and insufficient excited force below 10 Hz.
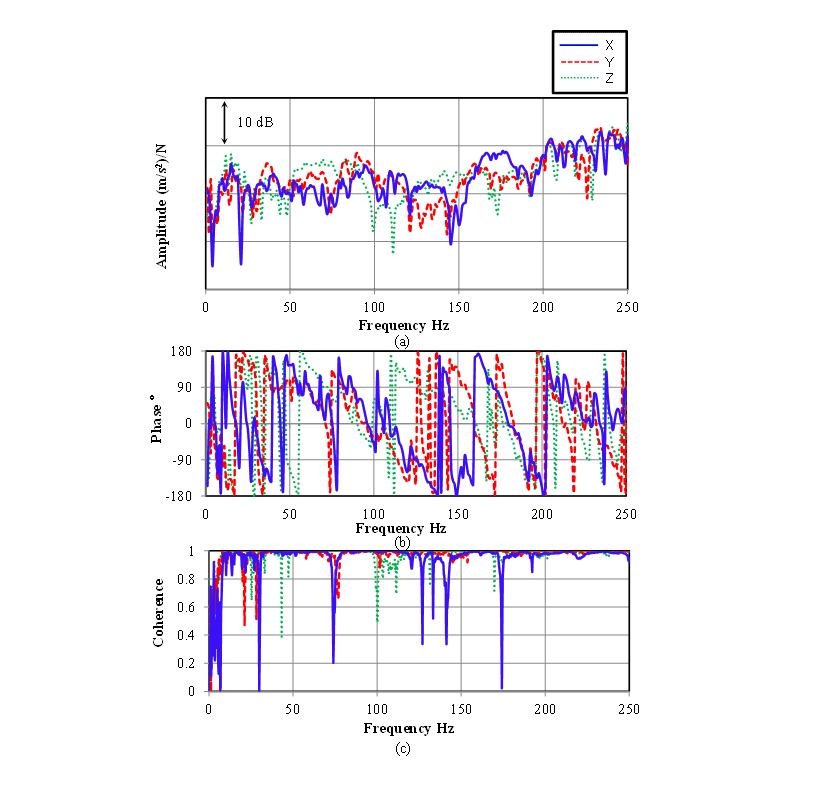
(a) Amplitude, (b) Phase, (c) Coherence
3.3. Transfer Path Analysis Results
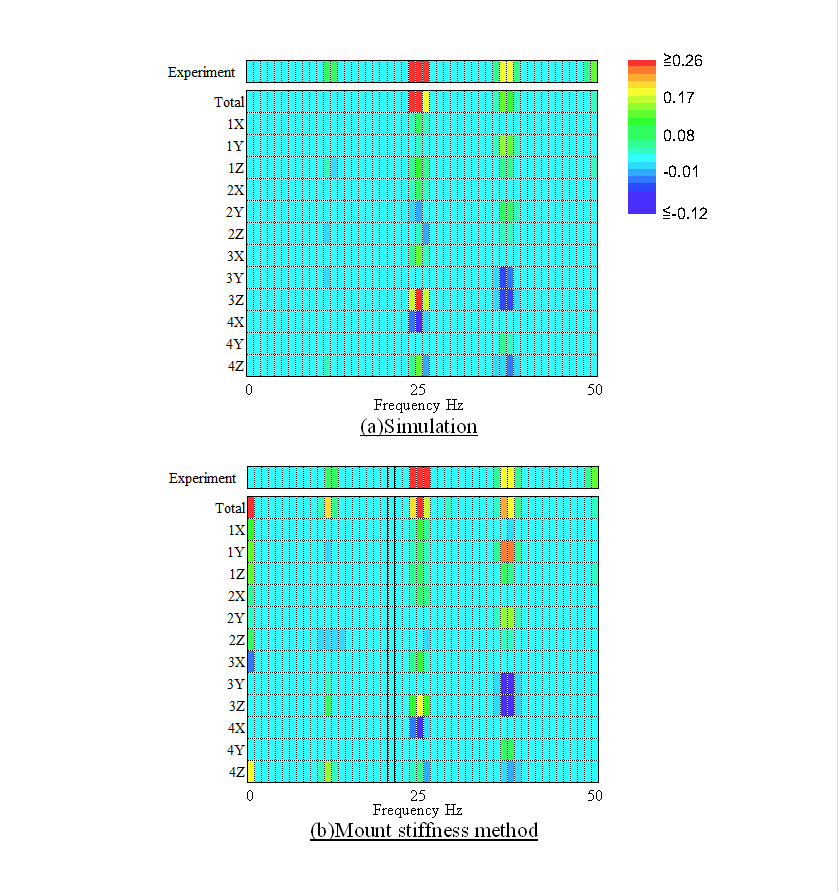
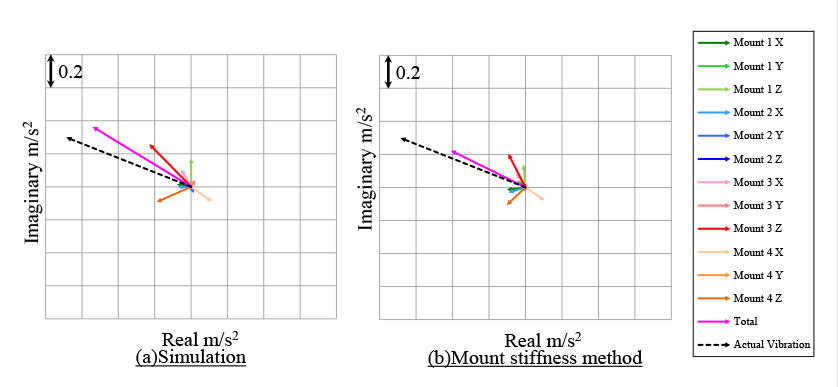
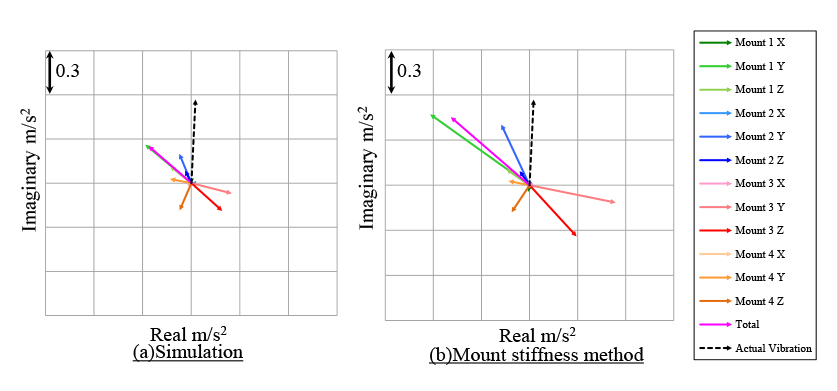
This section describes the results of the vibration transfer path analysis for the operator position. Fig. 11 shows the contribution of each path to the vibration at the floor position. Fig. 11a is the contribution based on the inputs obtained using multibody dynamics and Fig. 11b is the contribution based on the inputs identified using the mount stiffness method. The actual vibration amplitudes are also shown at the top of each figure. The main frequency of the actual vibration is 25Hz that is the first order component of the engine speed. Similarly, 25 Hz component of the total vibration amplitude by the transfer path analysis is big. When focusing the 25 Hz vibration, the most contributory path is the Z direction of mount 3. X direction of mount 4 shows negative contribution. For 37 Hz vibrations which is the 1.5 order component of the engine speed, the contribution of the Y direction of mount 1 is biggest, and the Y and Z directions of mount 3 show negative contribution. Both the mount stiffness method and proposed method show the same tendency. Figs. 12 and 13 plot the contribution vibration of each path on the complex plane for 25 Hz and 37 Hz respectively. The actual vibration measurement values are also plotted in the same figures as well. The phase reference for each path is the Z direction of mount 1. A comparison of theses methods shows good agreement for both amplitude and phase. These results reveals the effectiveness of the vibration transfer path analysis based on inputs obtained from multibody dynamics.
3.4. Prediction of Vibration Level
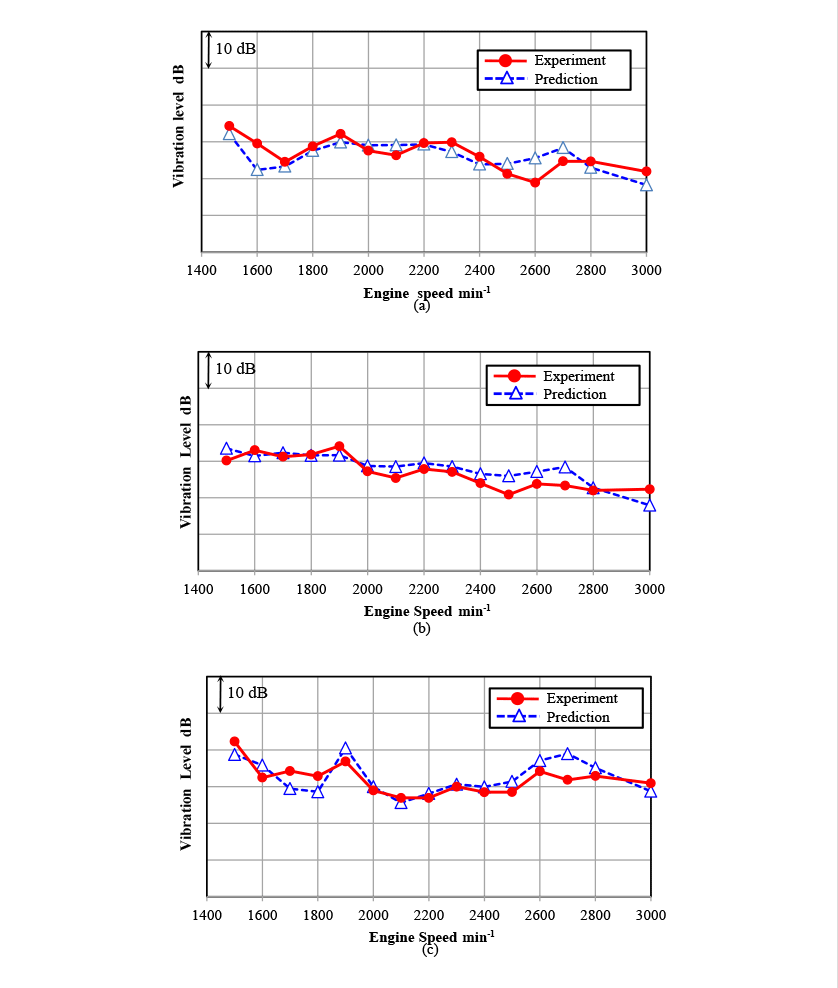
The vibration level at the operator position is predicted using the transmitted vibration force obtained by multibody dynamics and the measured FRF. Fig. 14 shows a comparison of measured and predicted vibration levels. The vibration of the steering is corrected by hand-transmitted vibration weighting factor(8), and the vibrations of the seat mounting position and floor are corrected by whole-body vibration weighting factor (9). The measured and predicted vibration levels show good agreement, with differences being within 3dB. It can be said that the vibration level of the operator position can be predicted using multibody dynamics for engine and measured FRFs.
4. Conclusions
The effectiveness of the hybrid transfer path analysis method using transmitted vibration forces obtained by engine multibody dynamics and FRFs obtained experimentally is confirmed. The conclusions are as follows.
- The contributions of each path to the vibration in the operator position obtained using the proposed method show the same tendency as those obtained by the current mount stiffness method. The proposed method and mount stiffness method also show good agreement for the amplitudes and phases of each path.
- The vibration level of the operator position predicted using the proposed method agrees with measurements to an accuracy of within about 3 dB. It is possible to perform a parameter study of the inputs for the vibration level of the operator position.
References
- (1)Peter, A. G., “Advanced Transfer Path Analysis Methods”, 2012, LMS Japan, p.7-12 in Japanese.
- (2)Raub, J. et al., “Analytical Investigation of Crankshaft Dynamics as a Virtual Engine Module”, 1999, SAE Technical Paper 1999-01-1750.
- (3)Sonntag, H-D. et al., “Acoustical Optimization based on modern CAE tools”, 2001, JSAE Annual Congress Proceedings, NO.59-01, p.1-4.
- (4)Kannan, M. et al., “Analytical Prediction and Measurement of Engine Mount Forces”, 2007, SAE Technical Paper 2007-32-0105.
- (5)Masahiro Akei, et al., “Study of Experimental and Simulation Method for Prediction of Engine Transfer Force” 2012, Dynamic and Design Conference 2012, NO.745 in Japanese.
- (6)David, I.G. Jones, “Handbook of Viscoelastic Vibration Damping”, 2003, Maruzen, p.49-52 in Japanese.
- (7)JIS K 6394: 2007, Rubber, vulcanized or thermoplastic -- Determination of dynamic properties in Japanese.
- (8)ISO Standards 5349-1: 2001, Mechanical vibration -- Measurement and evaluation of human exposure to hand-transmitted vibration.
- (9)ISO Standards 2631-2: 2003. Mechanical vibration and shock -- Evaluation of human exposure to whole-body vibration.
-IMPORTANT-
The original technical report is written in Japanese.
This document was translated by R&D Management Division.
Author


