Development Division
Agricultural Operations Business
YANMAR Technical Review
Development of the Intelligent Combine Harvester which Contributes to Increase in Productivity of Agriculture
Abstract
Even if yield loss occurred by a conventional combine harvester, it was difficult to perform appropriate adjustment. The operator of a conventional combine harvester was not able to identify a cause of the yield loss. The intelligent combine harvester can monitor grain flow rate and yield loss in realtime. The operator can assume a cause of the yield loss without reducing yield and efficiency by monitoring yield loss. And the operator can grasp the state of the detailed farm field by monitoring grain flow rate.
1. Introduction
Agriculture in Japan has been undergoing major changes in recent years associated with trends such as an aging workforce and a shrinking consumer population. Of the current farming population (1.47 million business entities), the consolidation of farmland under the management of “certified farmers” (230,000 business entities) was 49% in 2014 (2.21 million hectares of farmland consolidated for use by certified farmers out of total farmland of 4.54 million hectares), with half of all farmland in Japan being farmed by 16% of agricultural business entities.
Furthermore, with the fall in rice prices over recent years having become an enduring trend, how to improve land and labor productivity in order to improve profitability has become a pressing challenge for certified farmers.
As a role of agricultural machinery manufacturer, Yanmar has set out to overcome this challenge by focusing in particular on harvest volumes, which have a direct influence on income. This report describes the development of technologies for providing realtime information on harvest flow rates and losses through visualization during harvesting.
2. Outcomes of Intelligent Combine Harvester Development
This section describes a case study of the use of technologies for providing realtime information on harvest flow rates and losses through visualization during harvesting.
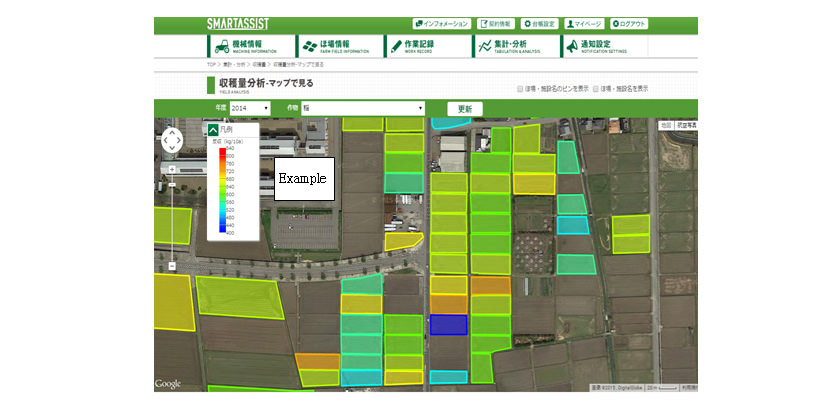
1) Visualization of Field-by-field harvest quantity
Presenting a color-coded display of the production per tan (harvest quantity/10a) of each field, as shown in Fig. 1, enables this yield information, which was previously comprehended sensory and roughly, to be put to use for productivity improvement. Specifically, the availability of accurate field-by-field data on the variation in harvest quantity means it can be used as feedback for fertilizer planning for the coming year, reducing unnecessary spending on fertilizer and achieving stable yields.
2) Visualization of information on harvest flow rates and losses during harvesting
If harvest flow rates and losses are known during harvesting, adjustments to the combine harvester can be optimized. In particular, the only way to check on harvest losses in the past was to stop the combine harvester in order to get off and check the reaped field. While losses can occur due to field conditions such as crop lodging (the paddy rice falling down), the condition of the crop or field is not the only possible cause. Losses can also be due to human operation defect or poor adjustment. If information on losses can be visually grasped , even less experienced operators can track losses and reduce losses by making adjustments as they go, such as to the dust discharging valve or “clean selection” separator.
3. Specific Contents of the Developments
3.1. Harvest Quantity Monitor
1) Conventional harvest quantity measurement system
[Structure]
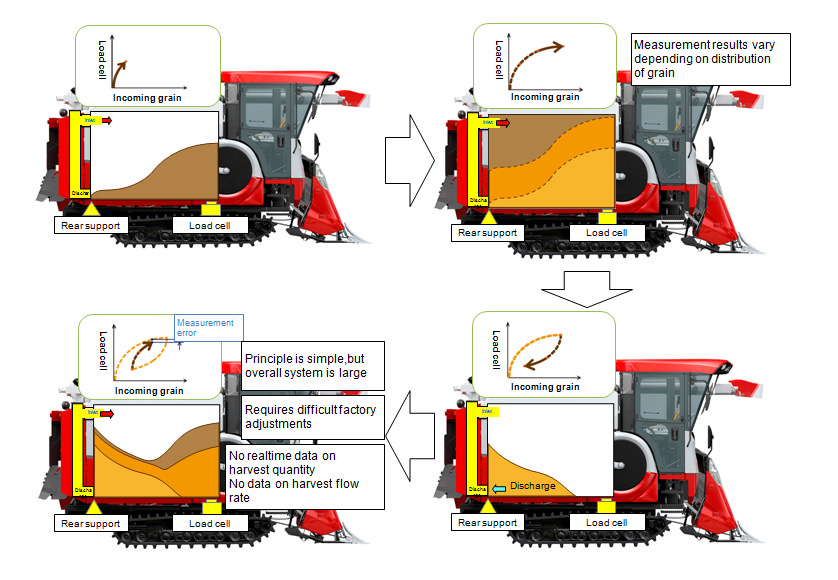
The conventional harvest quantity measurement system worked by using a load cell located under the front of the grain tank to measure the weight of harvested rice.
[Problems]
- Because the load cell was located on one side of the tank, the measurement depended on how the rice was distributed in the tank. This resulted in poor accuracy unless the tank was full.
- Because the system worked on the method of measuring the entire weight using a load cell, it also detected the vibration of the combine harvester. This prevented it from accurately measuring weight increases and made it impossible to obtain realtime data on harvest quantity.
- When discharging rice before the grain tank is full, the distribution of rice in the tank would change (changing the weight distribution). When harvesting resumed, this different distribution would change the measured weight.
- Because the overall system size (load cell) was large, it had a high cost and was also heavy.
2) Newly developed harvest quantity measurement system
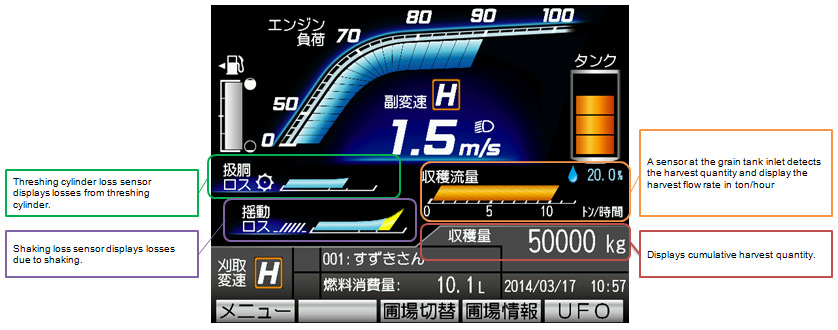
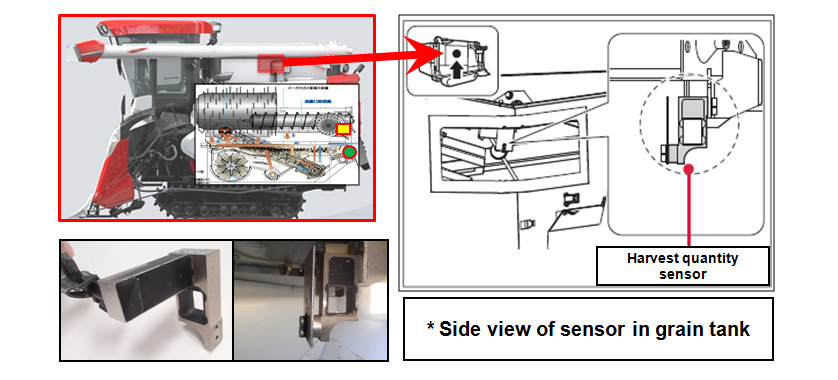
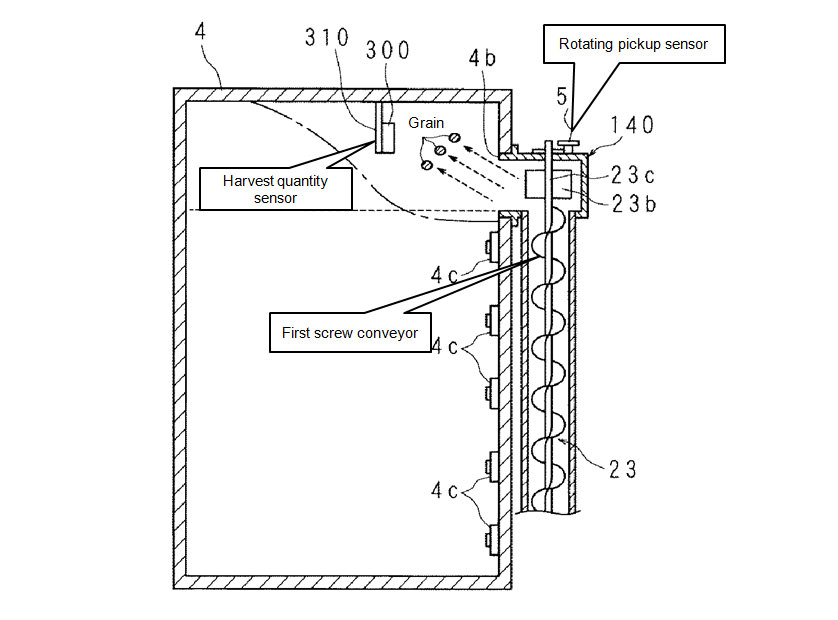
The sensor for measuring harvest quantity is a small load cell (matchbox-sized) located on the front of the grain tank inlet (see Fig. 4).
Unlike the conventional system, the new harvest quantity measurement system works by measuring the force of impact of each throw of incoming rice and using this to calculate the harvest quantity. This overcomes the problem of variability caused by the distribution of rice in the grain tank and means the system can produce measurements in realtime. Fig. 5 shows a graph of harvest flow rate and quantity against time series. The harvest flow rate varies in realtime in accordance with factors such as the vehicle speed and straw discharging flow rate.
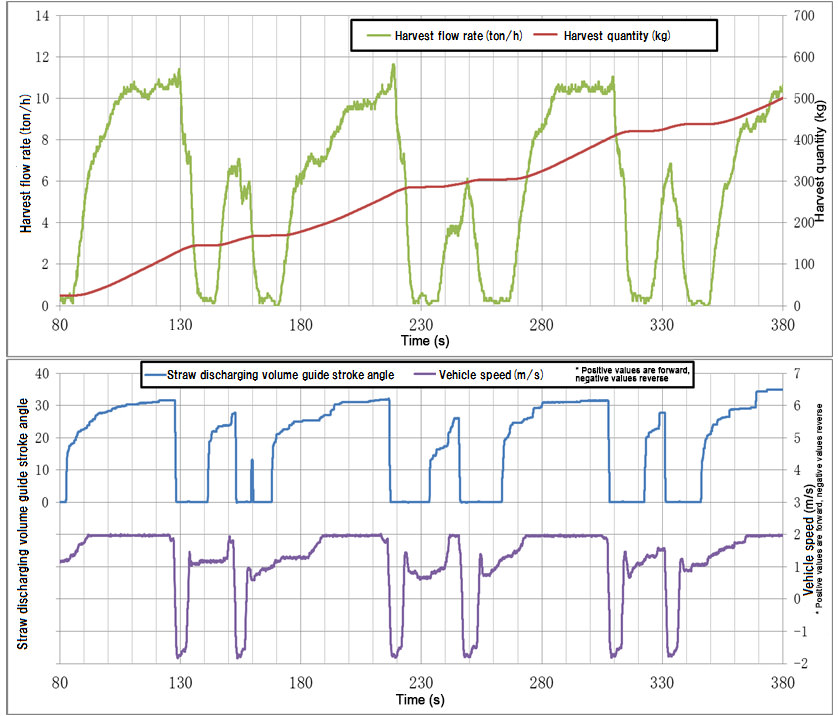
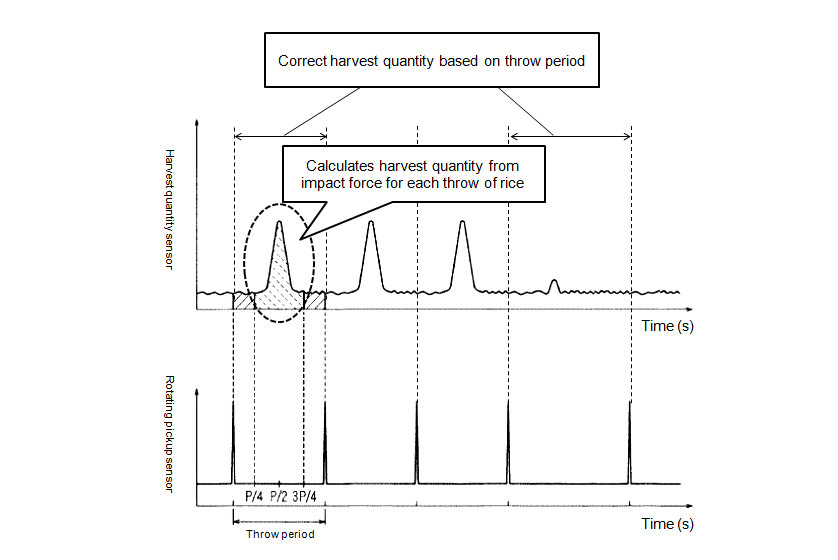
To improve the accuracy of harvest quantity measurement, the system detects the throw period and timing and corrects the harvest quantity based on the period. The engine speed (and throw period) varies depending on the workload. While this also changes the thrown rice speed and therefore changes the impact force detected by the sensor, a correction is performed to maintain accuracy.
3.2. Loss Monitor
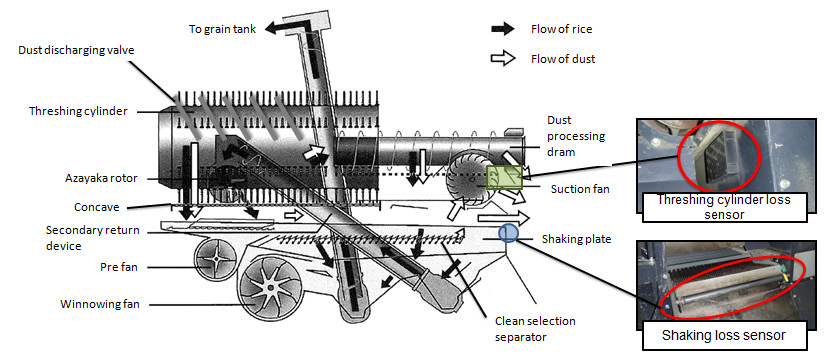
The functions of combine harvesters includes both threshing and sorting. The system has two loss sensors. Losses due to threshing are primarily detected by a threshing cylinder loss sensor and losses due to sorting by a shaking loss sensor.
1) Threshing function
The threshing cylinder threshes the rice such that the grain falls through a concave and down onto the shaking plate below, with any rice or dust that does not pass through the concave carrying on through the dust discharging drum to be ejected from the dust discharging chute. This discharged rice is detected as a loss. Adjustment inside the threshing chamber is performed using the dust discharging valve (the valve that determines how long the rice and dust remains in the threshing chamber). If the dust discharging valve is open too wide, the rice fall will tend to happen closer to the rear side of the combine harvester, causing losses as more rice is carried through and discharged. Closing the valve too much, on the other hand, results in damage to the rice.
2) Sorting function
The threshed rice and dust falls from the threshing cylinder onto the clean selection where it is separated by a shaking motion. Any rice that makes it to the end of the clean selection to be discharged from the rear of the combine harvester is detected as loss. If the clean selection clearance is closed too small, losses will increase due to rice not falling through. If the clearance is opened too wide, the proportion of dust getting into the harvested grain will increase.
Up to the present, there have been no combine harvesters on the market in Japan that output loss information. Even when losses were checked visually, there was no way of knowing whether they were due to threshing (threshing cylinder loss) or sorting (shaking loss). This meant that, even when loss was evident, it was difficult to decide what adjustments to make to the combine harvester. Being equipped with a loss monitoring function makes it possible for operators to reduce losses by making adjustments to the combine harvester based on the actual state of the losses, such as closing the dust discharging valve if threshing cylinder losses are high, or opening up the clean selection clearance to proper position if sorting losses (shaking losses) are high.
Prior to the equipment of a loss monitoring function, operators faced a potential uncertainty whereby they could not increase work speed without risking losses. Harvesting at a slower speed due to fear of losses has become a reduction of work efficiency problem. Fig. 9 shows the improvement work efficiency by using the loss monitor, as determined by testing at Yanmar. With standard adjustment states, the shaking losses exceeded the standard criteria. Whereas bringing the losses back within the standard by reducing vehicle speed required slowing down from 2.0 m/s to 1.6 m/s (20% drop in harvesting efficiency), because the loss monitor indicated that the bulk of losses were due to shaking losses, losses were also able to be reduced to within the criteria without slowing the combine harvester (without reducing harvesting efficiency) by shifting the sorting dial from [4] to [6] to adjust the clean selection clearance amount .
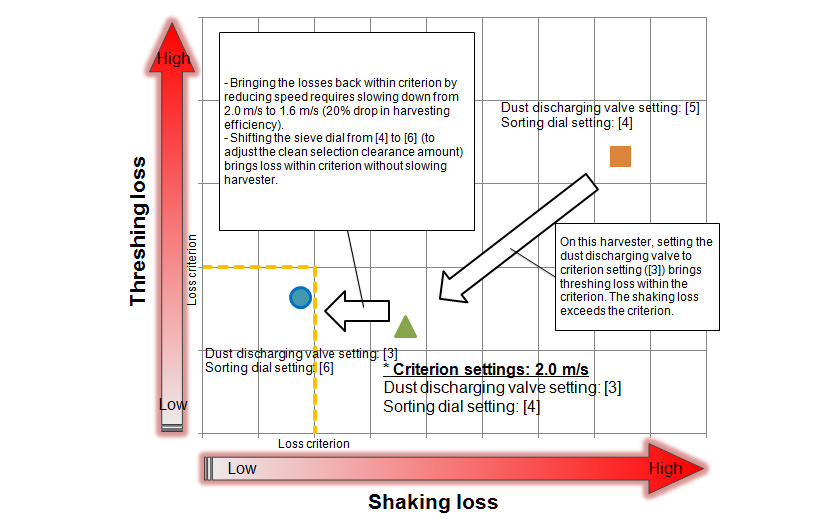
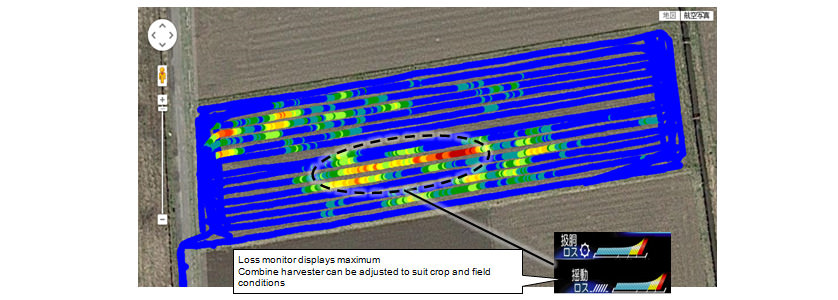
Fig. 10 was produced by experimentally fitting a GPS unit and overlaying the loss monitor display onto a map. By providing realtime information about losses during harvesting, the loss monitor enables adjustments to be made based on the crop and field conditions and prevents continuing harvesting losses caused by incorrect adjustments to the combine harvester .
3. Conclusions
Yanmar received the following feedback from principal farmer customers (certified farmers ) who had a test ride on the Intelligent Combine Harvester.
Customer feedback
- “While I already had a vague impression of which fields had high or low yields, having access to figures (though it was a little bit complex to operate) that I can use to compare fields means I can now consider actual measures , such as how to work or preparing fertilizer for the coming year.”
- “Because the daily harvest is large, we determine the harvest quantity and work volume on a daily basis based on the condition in the drying machine . Our practice has been to judge based on experience from each cultivar and progress of the rice growth by visual check,etc. Having combine harvesters that can provide harvest measurements enables us to grasp harvests on a field-by-field basis and make decisions during harvesting work. ( Not only helping plan for next year, but also this makes daily harvesting work easier.)”
While customers have recognized the benefits of the Intelligent Harvester function, namely being able to use data to improve the work efficiency and other activities such as material procurement, there still remains the challenge that know-how is needed to interpret the data and make the actual adjustments to reduce losses. Yanmar aims to reduce burden of customers by more improving operability and by providing easier to use and convenient functions. In the future, Yanmar intends to continue developing products that give delight to its customers and contribute to higher productivity.
-IMPORTANT-
The original technical report is written in Japanese.
This document was translated by R&D Management Division.
Author